 Read More
Simon Murphy
Fund Manager
Powerful words indeed, although given US inflation peaked at 15% in 1980, the year before Reagan took office, perhaps we can forgive the dramatic prose of what, for most, will feel like a lifetime ago. Yet the resurgence, or otherwise, of inflation has become one of the most hotly debated topics in the economic and investment world today.
That inflation is, at least temporarily, on the march again is relatively uncontentious given that last week the US headline CPI index hit 5% for the first time since the oil price spike of 2008, while core CPI (excluding food & energy) hit 3.8%, the highest for nearly 30 years, as the chart below highlights.

There are numerous drivers of this near-term spike including the dramatic year on year increase in oil and other commodity prices, resurgent demand following economic unlocking, supply shortages caused by lost production through lockdowns and even the delayed impact of the 6-day blockage of the Suez Canal back in March. Throw in enormous amounts of fiscal and monetary stimulus that have been pumped into economies during the pandemic and, arguably, the stage is set for a sustained period of substantially higher inflation than we have witnessed in recent years.
Central banks, led by the US Federal Reserve, are fervent in their belief that the key forces at work today are temporary in nature, and will unwind as economies and supply chains return to some level of post pandemic normality. They also point to inflation expectations remaining well anchored and still plenty of excess capacity in labour markets, such that the risk of material wage inflation remains very low.
Bond markets certainly appear to be buying in to the temporary narrative, as a quick glance at the chart of the US 10-year Treasury yield below will illustrate.

Yields peaked at 1.74% at the end of March, fell to 1.5% pre the latest inflation figures noted above and then, immediately post their release, fell further to 1.43%. At face value this suggests bond markets believe that ‘peak’ inflation is either here already or very close at hand.
The debate is a non-trivial one for all manner of reasons, although in these commentaries we try and limit our analysis to potential investment implications rather than a broader discussion. Inflation can, particularly if associated with significant changes in bond yields and/or interest rates, have a powerful impact on the relative performance of major asset classes and also – importantly from our perspective – on the relative performance of various stocks and sectors within equity markets. As an example, the chart below shows the relative performance of European cyclical stocks compared to defensive ones (yellow line) alongside the US 10-year Treasury yield over the last couple of years. Whilst clearly no proof of causality, the correlation is nonetheless obvious to see.

As you can also see from the chart, of late there has been a relative shift in performance within markets away from reflation beneficiaries towards more defensive/growth areas of the market, coinciding with the fall in the 10-year yield noted above. So, does this mark the top in terms of the outperformance of cyclical stocks for this particular cycle?
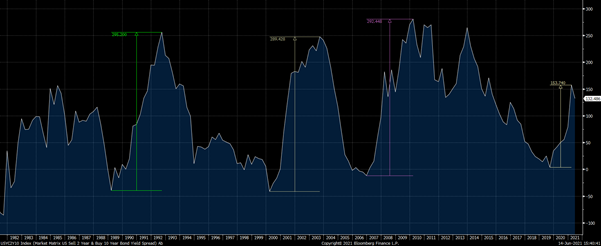
Given the scale of the inflationary surge we are currently witnessing, and all the anecdotal signs of significant pent-up demand, we are minded to think this is more likely a pause in an ongoing trend rather than the end of the road. The key chart for us in this respect is the one below.

The chart shows the changes in the 10-year minus 2-year US yield curve over the last 40 years or so. We have highlighted 3 previous major curve steepening periods (1989-92, 2000-2003, 2007-2010) and the current one. What becomes immediately obvious (to us at least!) is how much further the curve steepening typically goes once a major cycle starts. Again, whilst the past offers absolutely no guarantee of repeating, given our starting conditions for this particular cycle we strongly suspect it will, and in which case we should see considerably higher 10-year yields in due course with continued reflationary equity market leadership.
We will leave for another day the much thornier debate over whether this near-term period of inflationary pressure will ultimately remain transitory or if, indeed, it marks the end of 40+ years of persistent disinflation. The long-term implications once that particular debate has been resolved could indeed be profound, but from our perspective we don’t need to make that call today.
What matters right now is that inflation is elevated relative to recent history and is likely, given the strength in underlying economic activity we see, to remain so for some time. Whilst there are all manner of anecdotal signs of that being the case, we will leave you with one of our current favourites below. The chart shows the cost of a 40ft freight container on the Shanghai to Rotterdam shipping route over the last 10 years!

In summary, we think that the steepening of the yield curve has yet to fully play out and a corresponding further period of cyclical/reflationary outperformance is in the offing. Whether that lasts 6 months, a year or is the start of a multi-year fundamentally different investment environment remains to be seen. We will cross that particular bridge as and when we come to it.
WARNING: All information about the VT Tyndall Unconstrained UK Income Fund (‘The Fund’) is available in The Fund’s prospectus and Key Investor Information Document which are available free
of charge (in English) from Valu-Trac Investment Management Limited (www.valu-trac.com). Any investment in the fund should be made on the basis of the terms governing the fund