 Read More
Simon Murphy
Fund Manager
It is that time of year again where we issue a progress report on our suggestion that, starting from our first report in May 2020, ‘value’ (our proxy being Imperial Brands) might outperform ‘growth’ (our proxy being Rentokil Initial) over a 5-year period.
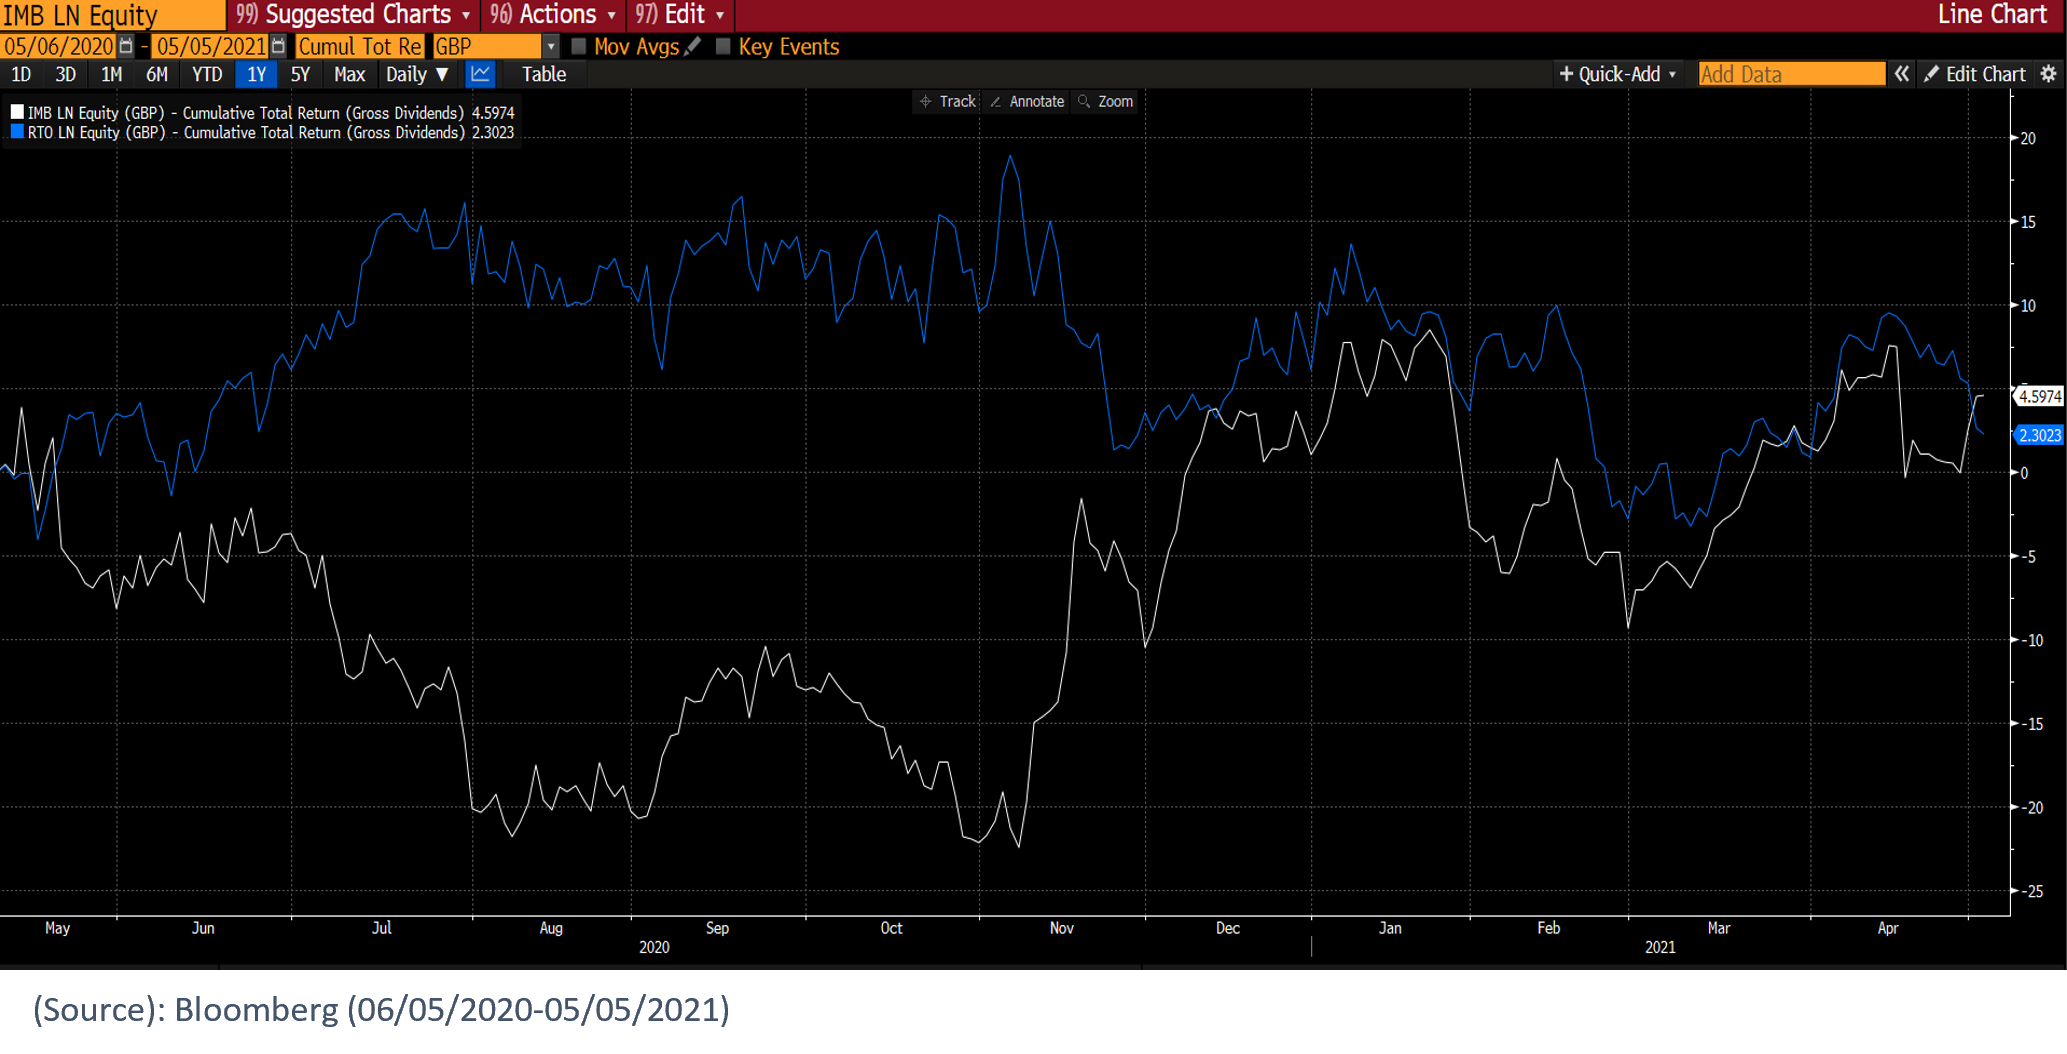
As a reminder from our first-year update in May 2021, Imperial had, despite a poor start, modestly outperformed Rentokil, delivering a total return of +4.6% compared to +2.3% over the period 6th May 2020 to 5th May 2021, as can be seen on the chart below (Imperial in white).

This was even though Rentokil, with particular help from their Hygiene division, delivered stronger financial metrics through the pandemic, had returned to the acquisition trail and reinstated their dividend. In contrast, Imperial had disposed of businesses and cut their dividend in order to refocus and reduce debt. So, what progress have the two businesses made over the last 12 months?
Rentokil has seemingly gone from strength to strength as the world has been recovering from the global pandemic. In the year to 31st December 21, ongoing revenue grew +9.8%, operating profit +19.5%, adjusted EPS +22.4% and the dividend +18.1%. Both the Pest Control and Core Hygiene divisions grew strongly organically, and the company had a solid year in terms of acquisitions, buying 52 businesses at a total cost of £496m.
The key highlight for the year though came in December 2021 when Rentokil announced the ‘strategically compelling’ acquisition of Terminix Global Holdings Inc for approx. $6.7bn in a combination of cash and Rentokil shares. This ‘transformational’ deal will substantially increase their pest control scale in North America and is expected to complete in the second half of 2022. Exciting stuff indeed.
By contrast, Imperial have seemingly had a much more mundane time of things. In the year to 30th September 2021, organic net revenue grew +1.4%, operating profit +4.8%, EPS +2.8% and the dividend +1.0%. A new ‘focused’ strategy was announced in January 2021, aimed at placing the consumer at the centre of the company’s decision making. Under a substantially refreshed senior leadership team, the company has developed a 5-year plan involving 2 years of ‘strengthening’ followed by 3 years of ‘accelerating’. Finally, given the dreadful Russian invasion of Ukraine, Imperial have ceased all operations in both countries, amounting to 2% of total group revenue.
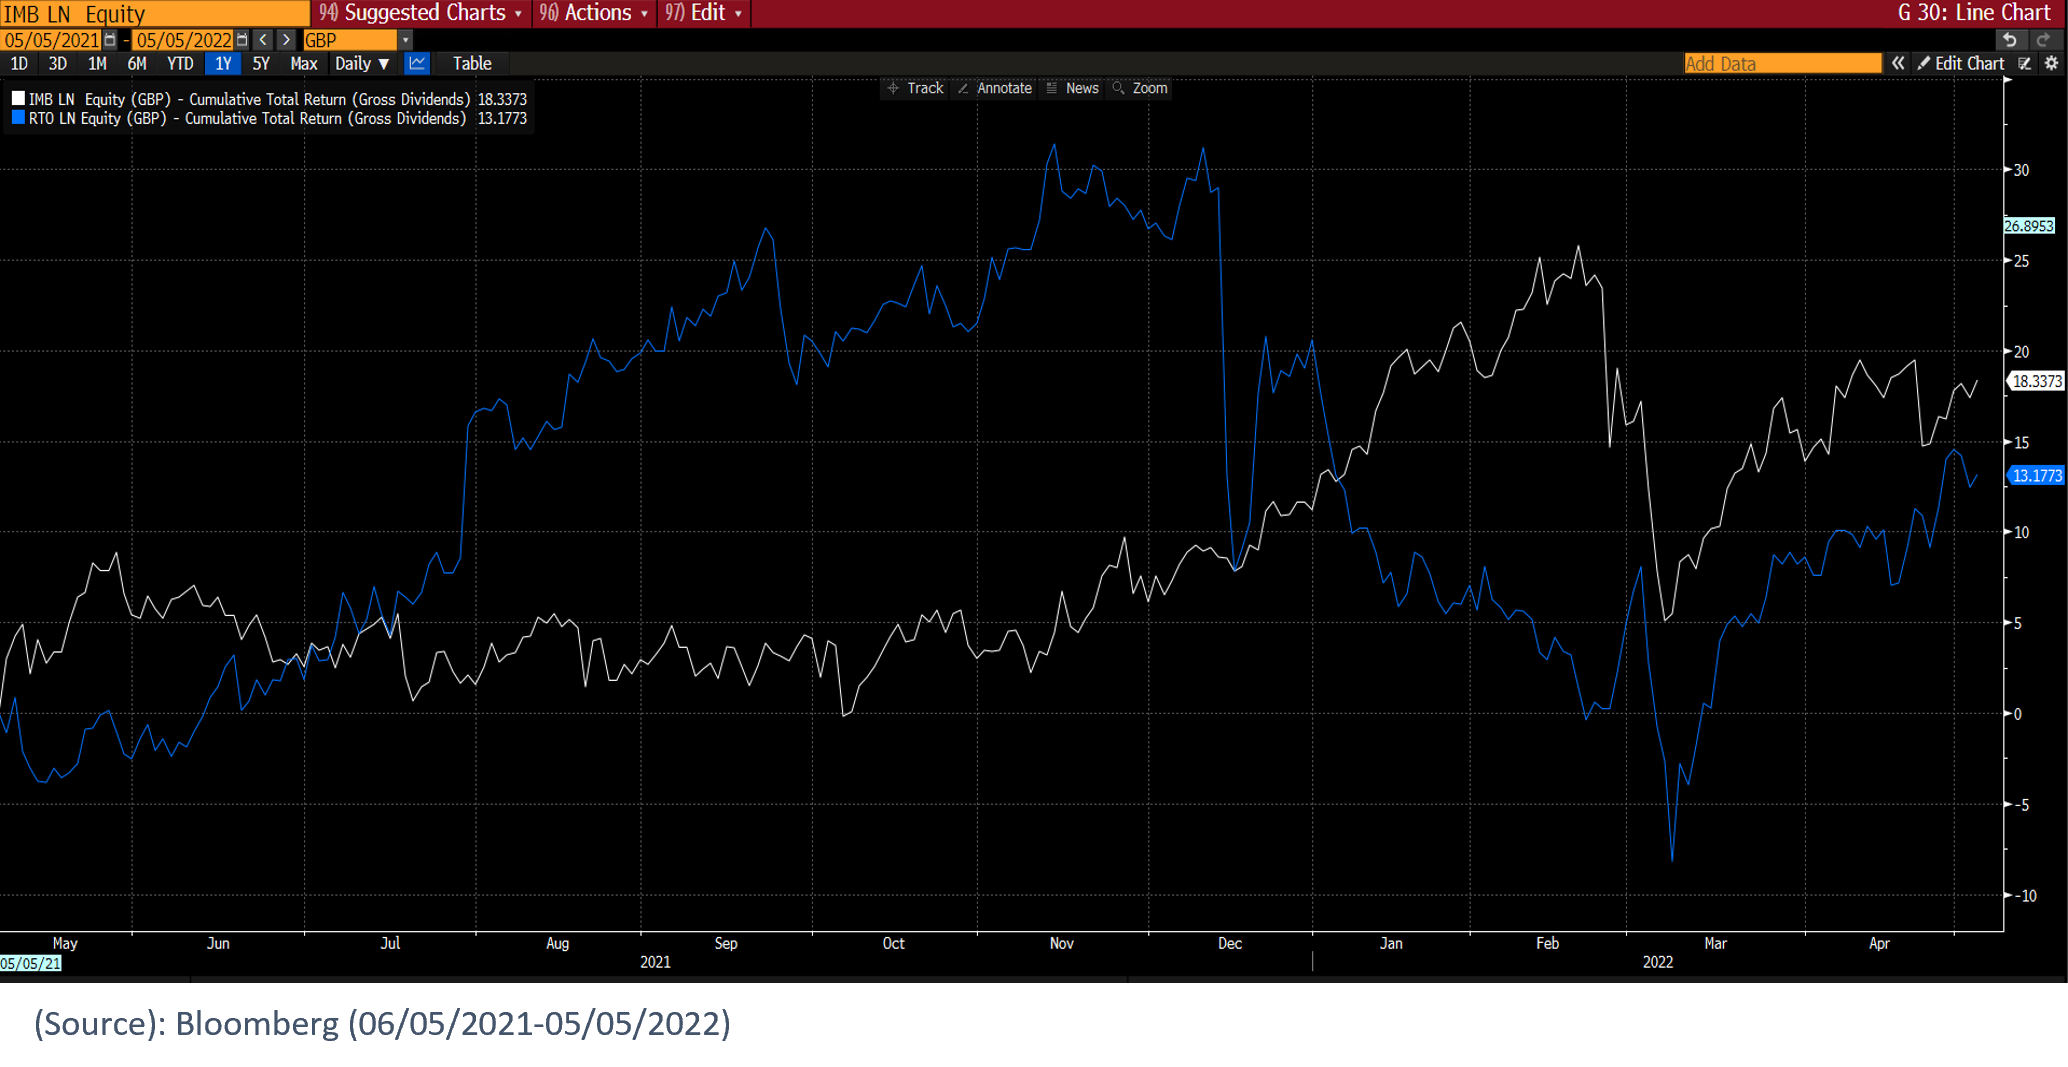
Given the respective business and financial developments noted above, it would be perfectly reasonable (again!) to expect Rentokil’s share price to have materially outperformed Imperial’s over the last year, particularly as Imperial has the significant additional headwind of being shunned by the ever-increasing amounts of capital managed under ESG frameworks. However, as can be seen in the chart below, despite a poor start again, Imperial has outperformed for the second year running, delivering a total return of +18.3% compared to +13.2% over the period 5th May 2021 to 5th May 2022.

So, two years into our ‘experiment’ Imperial have delivered a total return of +23.8% compared to +15.8% for Rentokil, despite the latter delivering materially stronger financial performance and arguably more exciting corporate developments.
The core of our argument is, of course, that starting valuations matter immensely to the potential medium term return outcomes that you receive and can, if sufficiently extreme, totally dominate the actual operating performance a business delivers. Two years ago, Rentokil was on a forward P/E ratio of 35x and today that sits closer to 28x. This ‘de-rating’ is a key reason Rentokil’s total return has not outperformed Imperial, despite the better business performance. In contrast, Imperial’s forward P/E ratio was 6x two years ago and is nearer 7x today.
We still have three years to see if our original assertion will fully play out and, if so, to what extent, and of course anything can happen in that time. However, given the dynamics that have been at play over the first two years, we feel confident that we remain firmly on the right track. What’s more, the implied Return on Capital Employed charts below (from Redburn) suggest there is still a long way to go in Imperial’s favour. As previously, we will be sure to check in again a year from now with a further progress report.

WARNING: All information about the VT Tyndall Unconstrained UK Income Fund (‘The Fund’) is available in The Fund’s prospectus and Key Investor Information Document which are available free
of charge (in English) from Valu-Trac Investment Management Limited (www.valu-trac.com). Any investment in the fund should be made on the basis of the terms governing the fund